The Toll Booth Moves
Part 1 of "Counting Chips": why the scarcity you're paying for is rarely the scarcity you'll end up owning
Here is a puzzle from a strange corner of the 2026 economy. Developers announced roughly twelve gigawatts of new U.S. data center capacity to open this year. By industry count, only about five are actually under construction, and a third to half of the planned openings are expected to slip or die.¹ Many of these projects have capital committed and GPU allocations secured. The thing the whole world was fighting over in 2023. Some have finished buildings.
What they are waiting for is a transformer.
Not a metaphorical one. A large power transformer, a technology whose basic design was settled in the 1880s, now carries a quoted lead time of three to five years. Medium-voltage switchgear (the industrial circuit breakers between the grid and the racks) is reported sold out through 2028. Grid interconnection queues in Northern Virginia, Phoenix, and Dallas run four to seven years.² Some of the most sophisticated machines ever manufactured are sitting in crates, waiting on equipment your great-great-grandfather would recognize.
A line going around the power industry captures it: "electrical equipment is less than ten percent of a data center's cost, and one hundred percent of its bottleneck."³
If that strikes you as a supply-chain hiccup (annoying, temporary, soon fixed) you are making the mistake this essay is about. The transformer is not an anomaly. It is the fourth stop in a sequence that has been running since 2023, and the sequence has a structure. Once you see it, you can stop being surprised and start anticipating.
The booth moves on a schedule
An AI data center is a set of tightly coupled layers: compute, memory bandwidth, packaging, interconnect, power delivery, cooling, grid connection. Tokens come out the far end only if every layer keeps pace, which means the system behaves like a convoy. It moves at the speed of its slowest ship.
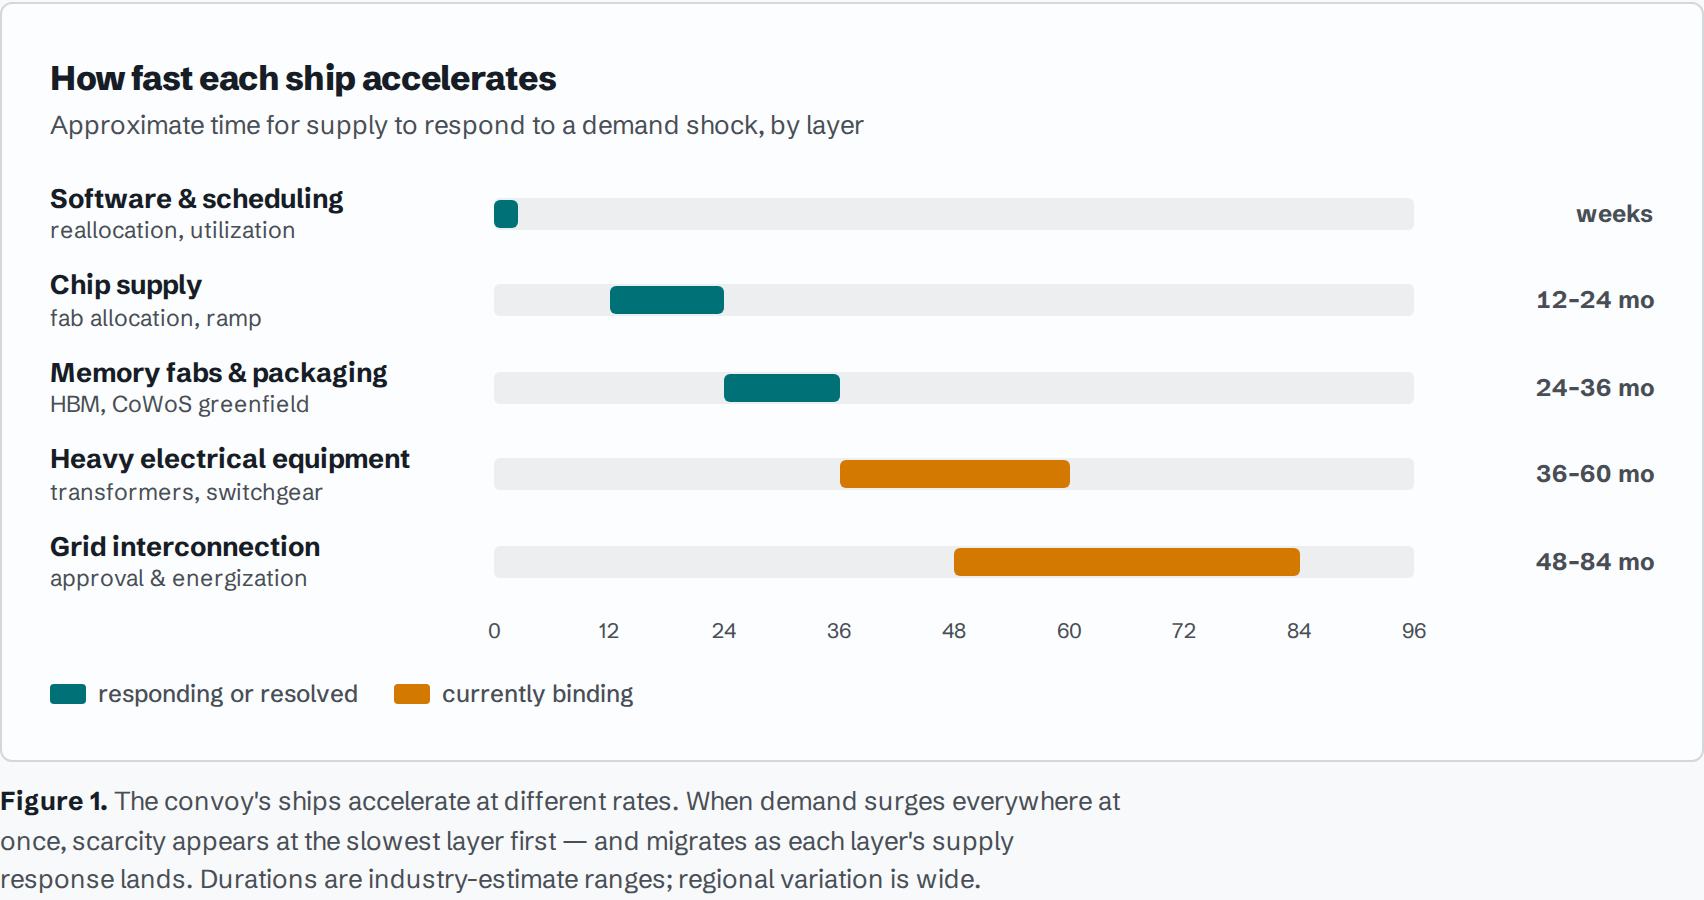
The ships accelerate at wildly different rates. Software reallocates in weeks. Chip supply responds in one to two years. Memory fabs and advanced packaging take two to three. Heavy electrical equipment takes three to five. A grid interconnection takes four to seven. When demand for the whole convoy surged at once. When the world decided, more or less simultaneously, that it wanted intelligence on tap. Scarcity appeared at the slowest-adjusting layer first, and a premium appeared with it. When that layer's supply response lands, the premium doesn't vanish. It migrates to the next-slowest layer.
Two boundaries before the history, both of which matter later. Supply-response time determines where scarcity lands; contracts, substitution, and bargaining power determine who profits from it. And the toll-booth image implies fixed traffic with a rotating collector, which is only approximately true... a bad enough bottleneck can delay spending, shrink it, or force engineering around itself. The rotation describes who collects from the spending that happens. It does not guarantee the spending.
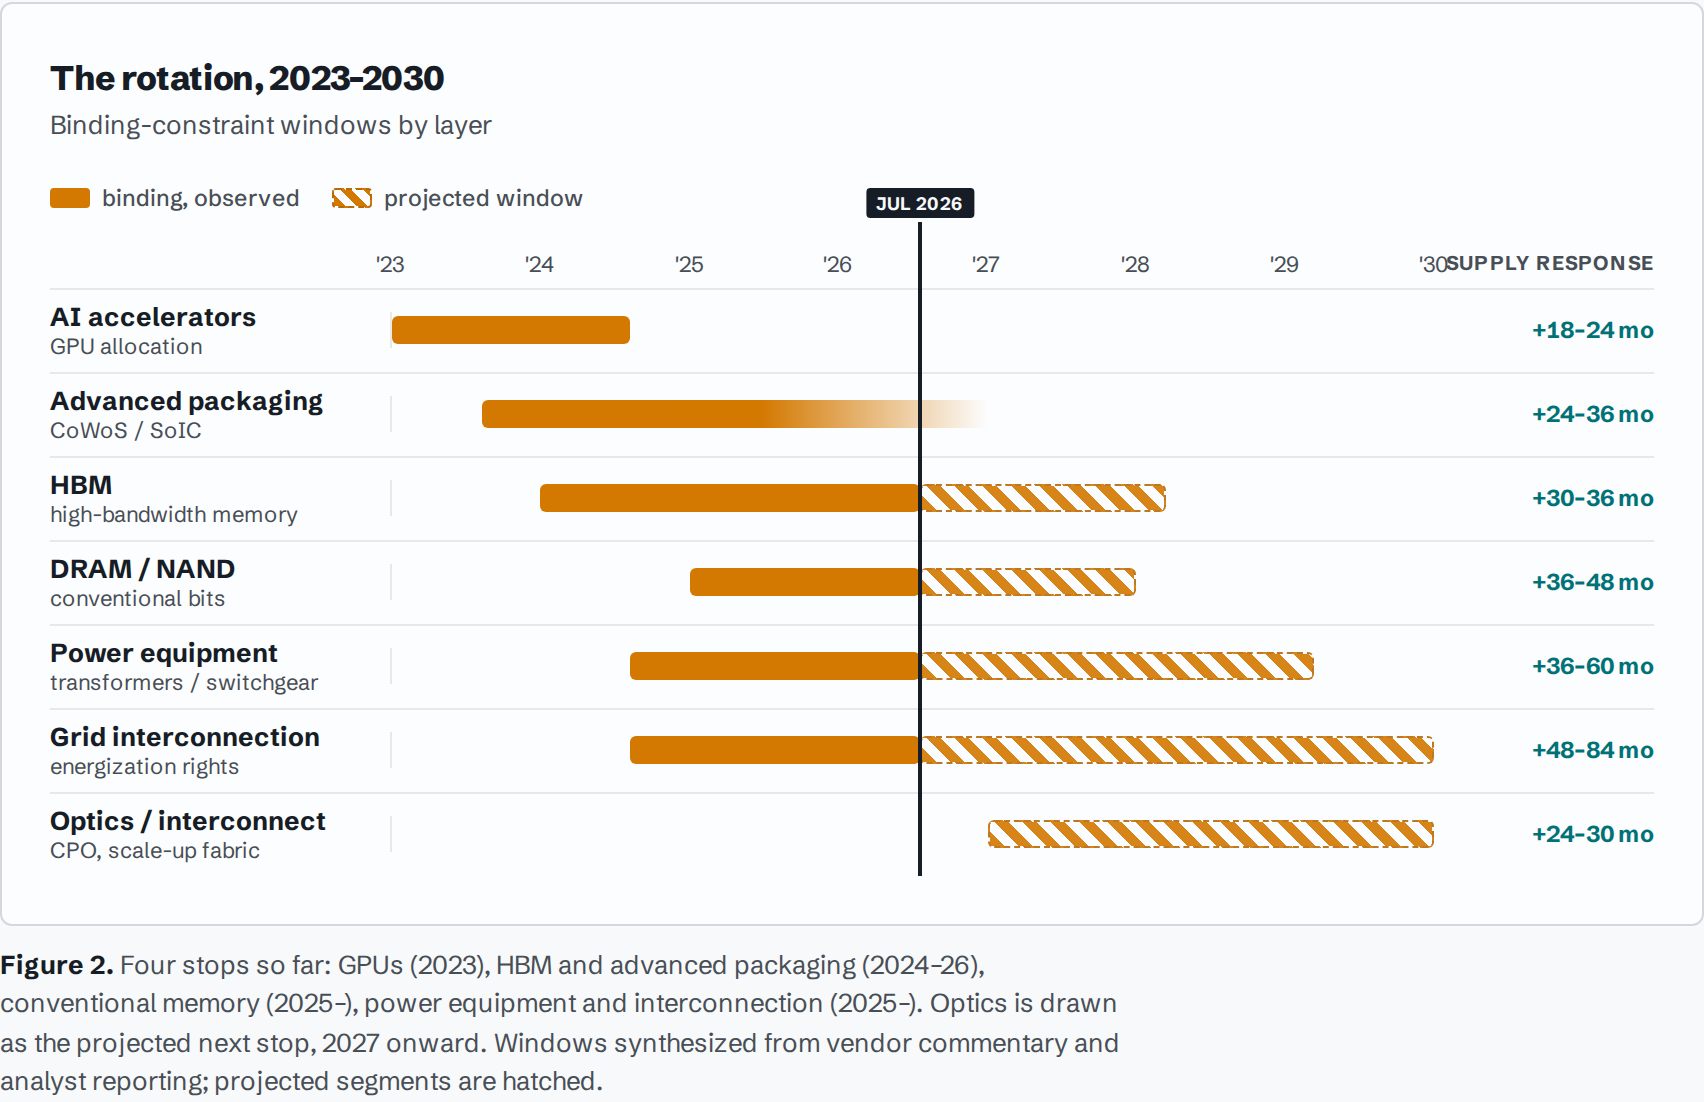
Now let's watch the sequence run. In 2023 the constraint was the GPU itself, when Nvidia's allocation list governed the industry. By 2024 it had moved to high-bandwidth memory and to CoWoS. The TSMC packaging platform that integrates logic and memory stacks on a silicon interposer. Which became so oversubscribed that packaging allocation, not chips, gated output. Then packaging did what constrained industries do: it responded. TSMC is expanding CoWoS capacity roughly tenfold from late 2023 through this year, and the supply gap is closing.⁴ In 2025 the premium migrated to conventional memory, where scarcity pricing pushed Micron's gross margin to 84.9 percent. A number that says buyers need supply more than suppliers need buyers, for now.⁵ The fourth stop is the transformer queue outside your window.
Three questions wearing one costume
When investors hear "X is the bottleneck," they treat it as one fact. It is at least three separate questions with three separate answers.
The first... who has pricing power right now?... is really two questions. Where is the physical constraint, and who is positioned to monetize it? They usually travel together, but not always. A constrained supplier locked into long-term contract pricing collects less than the shortage implies; the premium flows instead to whoever controls the scarce slot. A transformer delivery position, a packaging allocation, a signed interconnection agreement. In shortages, the queue position itself becomes the asset, and the manufacturer doesn't always own it. Either way, this pricing power is temporary by construction: the premium finances the supply response that ends it.
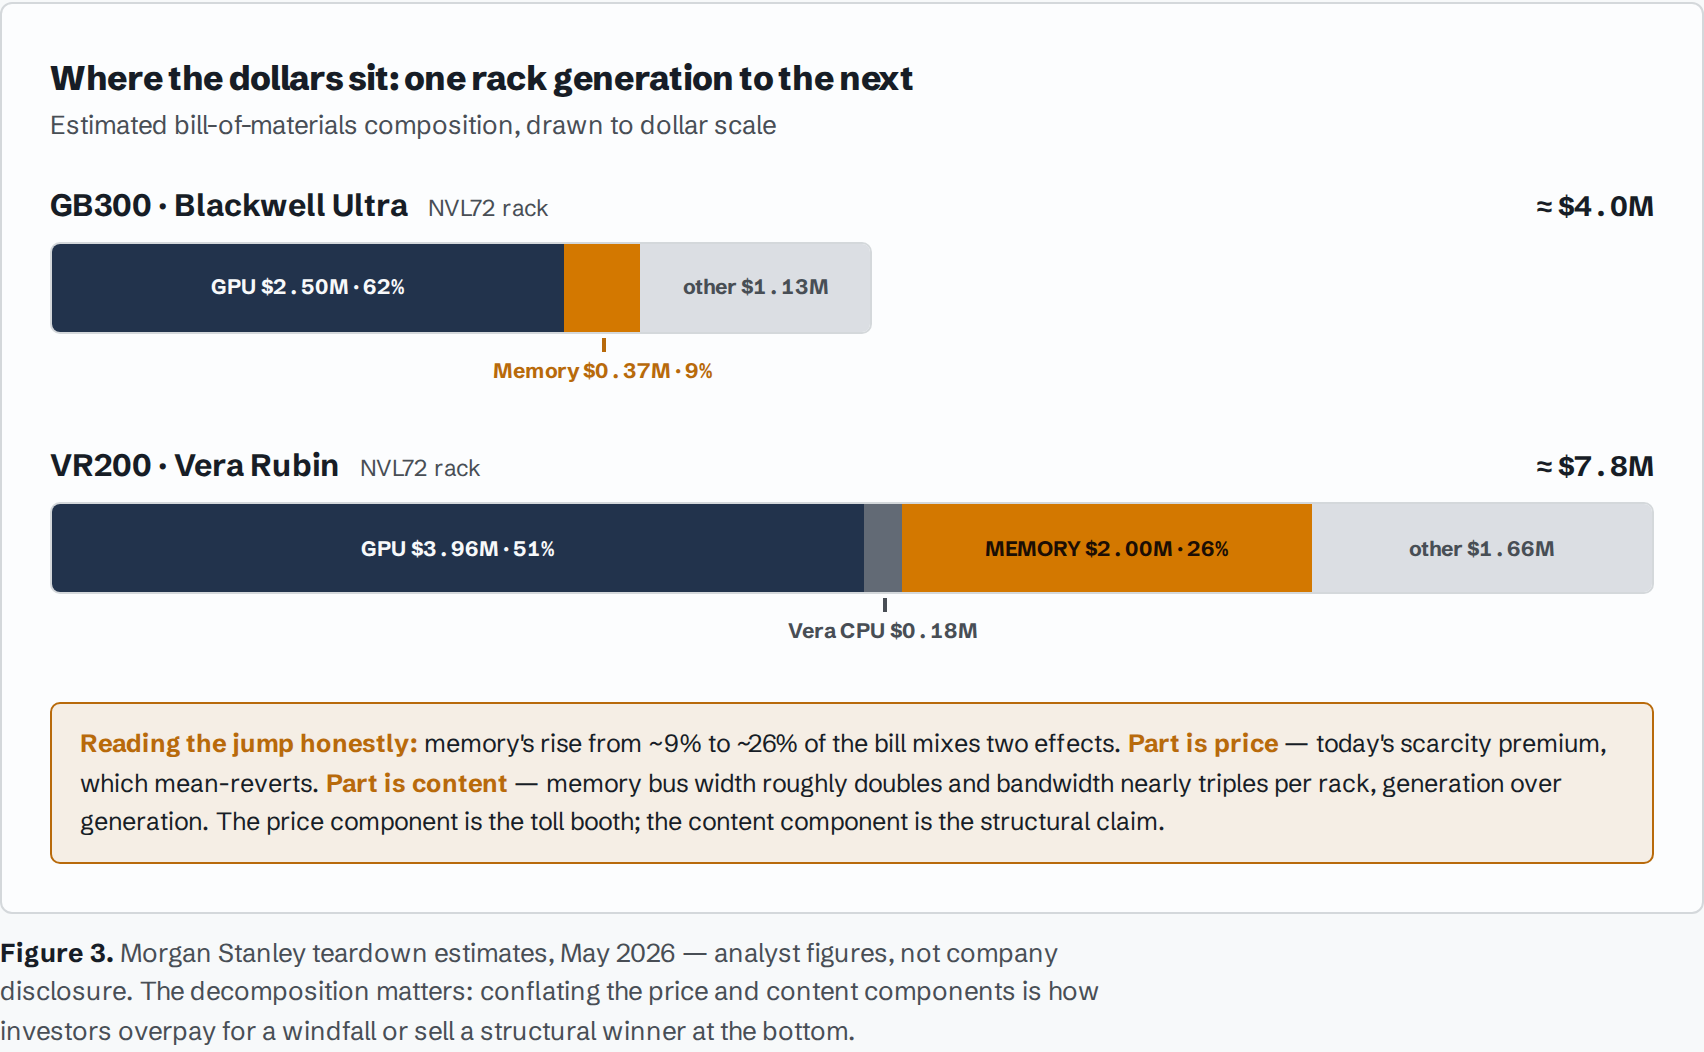
The second question: where do the dollars structurally flow? This is bill-of-materials share, and it moves on different logic. The illustration comes from inside Nvidia's own product. One Morgan Stanley teardown puts memory at five to ten percent of the Grace Blackwell rack's bill of materials, rising to twenty-five to thirty percent in the Vera Rubin generation shipping this year.⁶
That jump mixes two effects. Part is price. Today's scarcity premium, the temporary force described above. Part is content: Vera Rubin doubles memory bus width and nearly triples memory bandwidth per rack, because each new architecture demands more bytes moved per unit of compute, and bandwidth is physically expensive to build.⁷ The price component will mean-revert. The content component is the structural claim, and it faces real long-run counterforces (compression, lower precision) that deserve their own installment.
The practical distinction: memory's toll-booth moment will pass, while its physical content per system keeps growing. Those are different facts on different clocks. Confusing them is how you overpay for a windfall, or sell a structural winner at the bottom.
The third question: where does margin durably accrue? Durable return requires more than scarcity; it requires that customers can't easily route around you once the shortage ends. Transformer makers are a fair test. These are engineered-to-order products from a limited supplier base (not commodities) yet their pricing power has historically reverted toward utility-equipment norms when capacity catches up, because the binding barrier is capacity and lead time. TSMC's packaging franchise is also a bottleneck, but one wrapped in process knowledge on a treadmill that resets each generation. The difference is degree and durability, not presence and absence... and it's worth a decade. One more nuance: a windfall is not a moat, but it can buy the materials for one. Scarcity profits fund expansion, deepen customer entanglement, and sometimes harden into advantage.
Rent the windfalls, weight the bill of materials, own the moats... and know which of the three you're actually holding.
The clocks don't agree
The rotation matters to capital for a simple reason: money committed at one toll booth has to survive until relief arrives, and the durations involved disagree by nearly an order of magnitude. Nvidia ships a new architecture every twelve months. Hyperscalers depreciate the hardware over six years, after extending useful-life assumptions from three or four. A change estimated to reduce reported depreciation by $18 billion annually.⁹ The facilities are gated by power timelines of four to seven years. A twelve-month product, on seventy-two-month accounting, inside an eighty-four-month development queue. Three clocks measuring three different things, which is exactly why their interaction is where the risk hides.
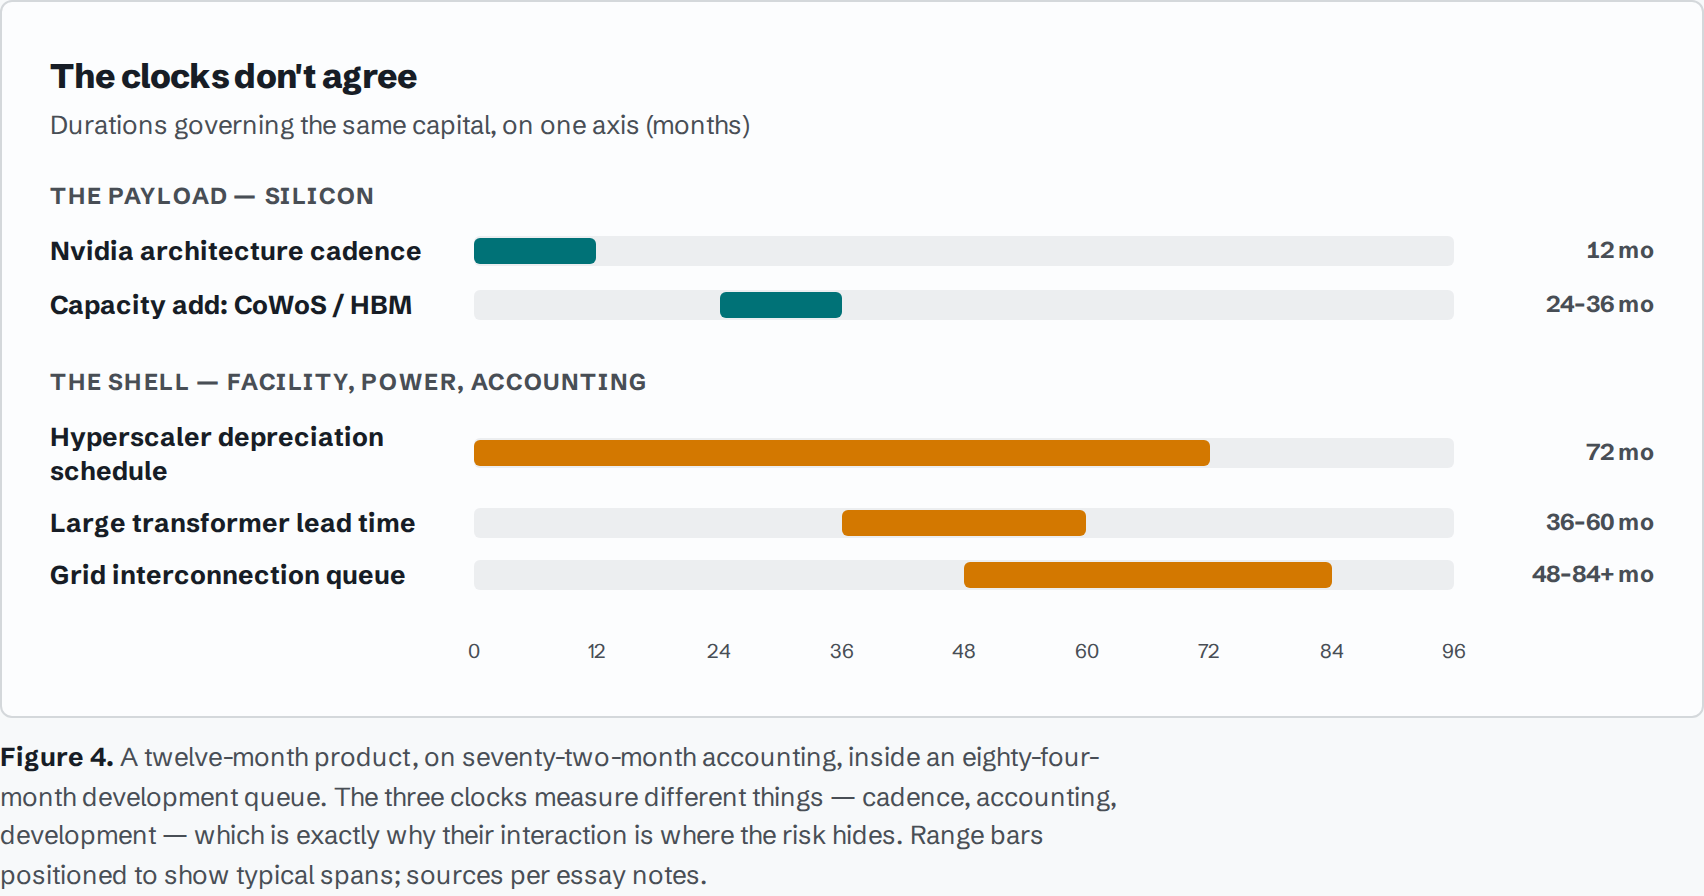
The industry's answer is the value cascade: years one and two on frontier training, three and four on production inference, the remainder on batch work. There is evidence for it; CoreWeave has said H100 capacity coming off its 2022 contracts re-booked at ninety-five percent of original pricing.¹⁰ There is a case against it, most prominently Michael Burry's claim that the industry is understating depreciation by roughly $176 billion between 2026 and 2028 — a short seller's position, not a finding.¹¹ And the operators themselves point both ways: Amazon shortened the useful life of some servers in the same period Meta extended its estimate. Different fleets and workloads, so the divergence doesn't prove nobody knows — but it does prove the answer isn't settled among the people with the best data.
What would settle it, in rising order of severity: weak secondary pricing for one-generation-old systems, softening utilization disclosures, a useful-life reduction in a filing, an impairment charge on stranded silicon. Distinct signals, not synonyms and the early ones are watchable now.
The convoy has to be going somewhere
Now the strongest objection. Everything above assumes the convoy keeps sailing. Its fuel is capital expenditure (roughly $660 to $690 billion of hyperscaler spending this year¹²) and capex is genuine demand for chips, transformers, and construction crews. What it is not is evidence of end demand. The AI revenue that would justify the spending mostly does not yet exist at matching scale; infrastructure spending is a forecast of monetization, made by companies whose stock prices reward the forecast.
The rotation model does not protect you from this. It tells you which scarcity you own, not whether scarcity stays valuable. If intelligence demand disappoints, the booths don't rotate; they empty in order, and a seven-year queue position for grid power is an asset only while someone wants the electricity. The 2019 memory bust is worth holding in mind as an analogy, not a prophecy: it followed the 2017 "data center supercycle" narrative by about eighteen months, and the investors who lost the most had correctly identified the bottleneck.
The structure is real, but the structure is conditional.
Where the booth goes next
A structural model earns its keep by being predictive, so end with predictions stated so they can fail.
Power holds its toll longest but "power" is several constraints, overlapping and regionally uneven rather than neatly sequential. Transformer and switchgear capacity gets relief first, as announced factory expansions land late this decade. Substation and transmission construction runs slower; interconnection approval slower still; generation is the residual constraint behind them all. Through it, the quietly appreciating asset is the signed interconnection agreement. With the caveat that its value depends on transferability, milestone obligations, and local rules. A queue position is an asset, not automatically a liquid one.
Optics is the forward rotation, and here is the mechanism: as scale-up domains grow from one rack toward multi-rack systems, electrical signaling runs out of reach and power budget, and the fabric goes optical. Nvidia's 2027 rack generation is designed around direct optical interconnects for rack-to-rack scale-up. Analysts put large-scale co-packaged-optics deployment at 2028–2030.¹³ The falsifiable version: watch CPO attach rates in switch shipments and the order books of fiber-alignment and laser-source suppliers through 2027. If those don't inflect by early 2028, this prediction is wrong.
The reframe to carry out of this essay: for fifty years, "who wins in semiconductors" was a question about products. The rotation makes the near-term question one about response times. The scarcity premium tends to surface wherever demand's clock runs fastest against supply's slowest and who pockets it depends on contracts, substitution, and who holds the queue. Durable return still requires the third question's answer: a position customers can't route around after the queue clears. Ask what's slow, who holds the slot, and whether anyone can own the slowness once it stops being slow. Because the scarcity you're paying for today is rarely the scarcity you'll end up owning. By the time it's obvious, the booth has moved.
Sources and confidence notes
Sightline Climate project-pipeline data, as reported by Bloomberg News, Q1 2026. Analyst estimate.
EPRI reporting and trade-press compilations (Data Center Dynamics and others), 2025–26. Industry estimates; ranges vary by region and equipment class.
Unattributed industry formulation in wide circulation, 2025–26. Aphorism, not a measurement.
TrendForce CoWoS capacity estimates, 2024–26 (≈13K wafers/month end-2023 to ≈120–130K end-2026). Analyst estimate.
Micron Technology quarterly results, fiscal 2026. Company-reported non-GAAP figure.
Morgan Stanley Vera Rubin rack bill-of-materials analysis, May 2026. Analyst estimate, not company disclosure.
Nvidia Rubin platform specifications; SemiAnalysis, "Vera Rubin — Extreme Co-Design," February 2026. Vendor specification and analyst verification.
(Note retired in this revision: fleet refresh-cycle estimates were removed from a load-bearing role.)
Aggregated analysis of hyperscaler filings (Introl and others), 2026. Analyst estimate.
CoreWeave public statements, December 2025. Company claim.
Michael Burry public statements and filings, 2025–26. Contested position by an interested party.
Aggregation of published capex guidance (Alphabet, Meta, Microsoft, Amazon), 2026. Author calculation on measured guidance.
Yole Group projections; OFC 2026 conference reporting. Analyst projection.